|
Neat idea. Great video using simplicity. Especially good use of focus to guide the viewers eyes. Really beautifully designed website too - with minimalist graphics and shows why a limited palette of colours is a good idea. Website here.
As a math teacher also, it's fascinating for a whole other reason. Now, is it going to help or hurt math students? PhotoMath from MicroBLINK on Vimeo
I think they'll continue to improve it, but I was pointed towards this error:
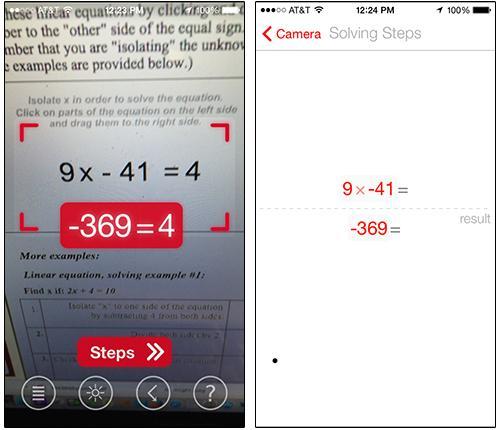
Remember, you're smarter than you're calculator, because you can tell if an answer makes sense.
Oh man, the Math/Socials/Media/Design teacher that I am have met their Venn Diagram intersection with these! (As always, click to see a bigger image) 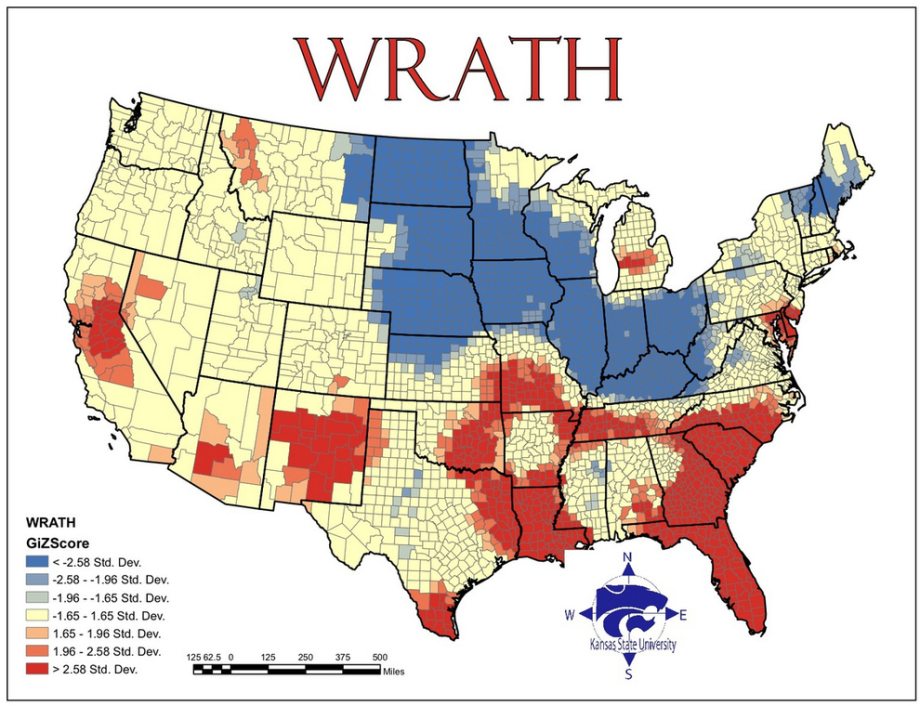 The 7 Deadly sins: Wrath, Greed, Sloth, Lust, Envy, Gluttony, Pride. Mapped onto US maps using certain data sources. Red means higher than average, blue means lower. See all of them here.  Labelled each state with the most popular TV show that takes place there (not necessarily filmed there, but where the characters are supposed to live). Interesting to see that all 50 states have had TV shows take place there. For more information go here.
 Someone has written a program to show the Prime Factorization of numbers, and it's really quite beautiful. Of course, this is a Math teacher talking, but still... It advances 1 per second, though you can speed it up too. The prime factorization is shown in the top left corner. Website here.
The pic to the left shows 121 = 11 x 11. The website has it in colour, which is pretty. |
This front page is for miscellaneous Media Arts things I find interesting but don't relate specifically to course work. Select the top tabs for assignments, etc.
Mr. Evans
questions? school email: Categories
All
Archives
April 2020
|
 RSS Feed